
Top 5 Ways N-sight Can Help Your MSP Client Reporting

By Joe Ferla

One of the things that I regularly get questioned about in my Operational Efficiency Boot Camp is the reporting in N-sight and what MSPs should be presenting to customers to show that they are properly performing their work.
I am a huge fan of monthly or quarterly business reviews to showcase your MSP client reports. I feel that for MSPs they are one of our greatest retention tools, and clearly demonstrate the value we provide. Getting just 30 minutes per month/quarter with your customers can be the difference between them thinking “they’re never around so clearly I don’t need an MSP as obviously everything is going well” and “man, I love my MSP.”
In this blog, I’ll go over my top five client-facing reports, why you should give them to your customers, and any gotchas to look out for when presenting the reports.
1. Executive Summary Report

Without question, every customer should be getting this report. It’s perfect for end users that want a quick, simple-to-read, couple-of-page document that gives them an overview of their MSP’s monthly work. The Executive Summary Report provides a general Health Score, a feature breakdown, and quick references to the features and services you as the MSP are utilizing in N-sight. There is even a glossary for non-technical end users that still want to be kept up to date with what their MSP is doing.
This report was the backbone of every QBR that I did as an MSP. I would always take 10-15 minutes to give the customer a rundown of the report and what I was doing as their service provider. This time also gave me a chance to cover how to best read the report, and explain where the metrics were being pulled from, for example:
- The patch management protection score looks at patches that were installed in the calendar month and since the report does not consider pending patches, only installed ones, the protection score is always a little low. I can’t tell you how many times the report was generated the day after Patch Tuesday and my patch protection score did not take into account the fact that I was purposely keeping patches from installing until I knew they were safe.
- The antivirus section will only work with devices that have integrated solutions on them. It will not recognize standalone MAV/EDR tools.
For more on the Health Score in the Executive Summary report (including a breakdown on components), please see our documentation here.
These quirks mean that when explaining the report, you must use a grading scale. This is due to the effect that the individual metrics have on the Health Score. For example, delaying patches until the last week of the month can result in a much lower-than-expected score.
- 0%-70%: there is a need for improvement and your service delivery may need to be revamped (I have rarely seen a score below 70% that comes from a healthy end-user environment).
- 70%-85%: Let’s take a look at the data and see where the metrics are causing a low score, OR if there is some room for improvement that needs to be discussed in the QBR.
- 85%-100%: We are doing well and let’s look at why.
2. Client Monthly Reports for Servers
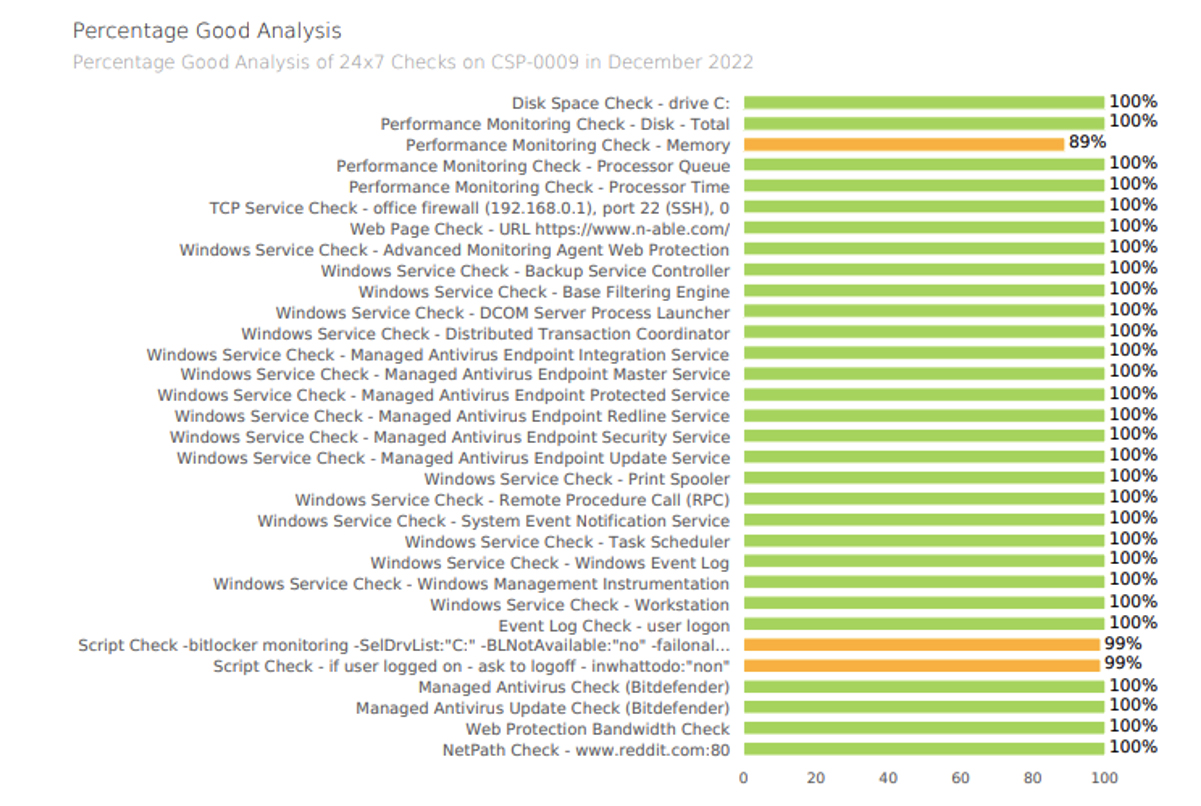
From one general overview report to another. After presenting the Executive Summary Report, I would move to the Client Monthly Report for Servers. Just as the Executive Summary Report breaks down what can be a very technical topic into bite-sized, easy-to-understand chunks, the Client Monthly Server Report presents a site-by-site breakdown of the work done for the end user’s servers. This allows you to provide a view of device health that the less technical folks can understand.
Every portion of this N-sight report comes with an entry in the glossary for quick understanding and, when needed, graphs that quickly and accurately show any trends that may be happening in the end user’s environment. This can be great for highlighting that, for example, a Disk Space Check has a high failure rate that reflects the need to expand the storage on a drive rather than the weekly remediation efforts that are taken to free enough space for the system to continue to operate. There are even sections solely dedicated to uptime. This means that if needed we can curate a report that speaks to the most technical of end users and the least technical as well.
This report was almost always part two of my QBRs, and a great place to start to dive into projects that are going to need to happen in the near future. While presenting there were not any real quirks to contend with other than filtering and presenting the information in a manner that the end user would understand, such as giving those less technical the proper amount and scope of data that met their level of understanding.
3. Active Directory Users Report
A “what happened, when, and where” report is always a nice thing. A centralized report that shows what Domain Controller (DC) password update events have taken place, what users are in that AD, their basic contact information, when their passwords were last changed, when they last logged on, and when they were created is invaluable. I used the Active Directory Users Report in all my QBRs. Security is increasingly becoming a major selling point for MSPs and this report hits a simple-to-understand basic portion of that. While I never spent much time on this it was a nice segway into security issues and vulnerabilities that need to be addressed. There is no fluff to this report, and it gets straight to the point.
Please note, this report is based on an Automated Task that must be on the DC of the site you want to run this report for.
4. Critical Event Report
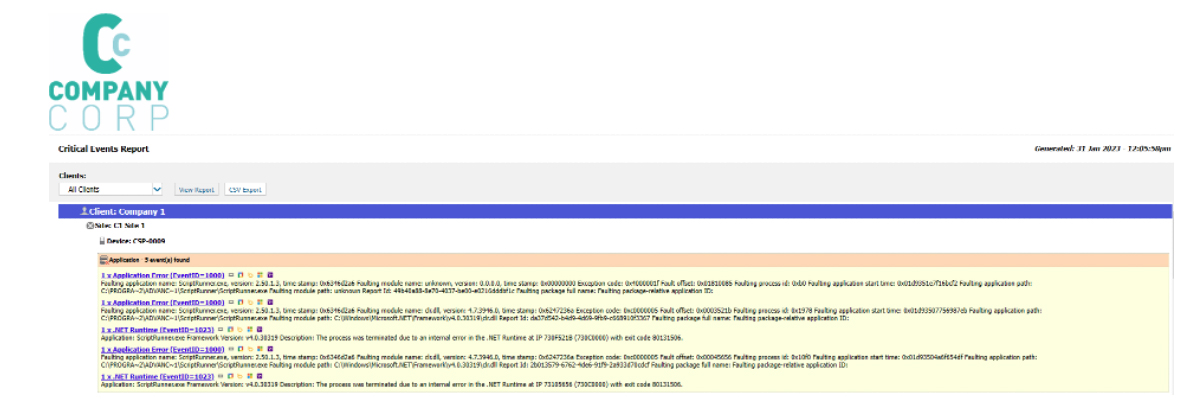
For those of you familiar with the Critical Events Report, you are probably thinking: why we would send a daily report to an end user? The answer here is that you wouldn’t. But you are going to need to take this report and create one of your own. I am of the opinion that if you are putting in the effort to monitor critical events, you should be reporting on them. By default, N-sight adds three critical event DSC checks (application log, security log, and system log) with the ability to add up to six more. The flexibility and number of checks here let me know that I should be providing additional information on what I am doing based on the status (pass/fail) of these checks.
Should I go into detail about what each EventID means, and the actual steps I am taking based on the information provided? Probably not. However, I should be receiving this report once a day and parsing out any information that directs my tech support or engineering team to act. This way I can provide my end users with peace of mind that, as their MSP, I am monitoring their environment and basing the services provided on their needs and specific environmental happenings.
5. Patch Management Overview Report
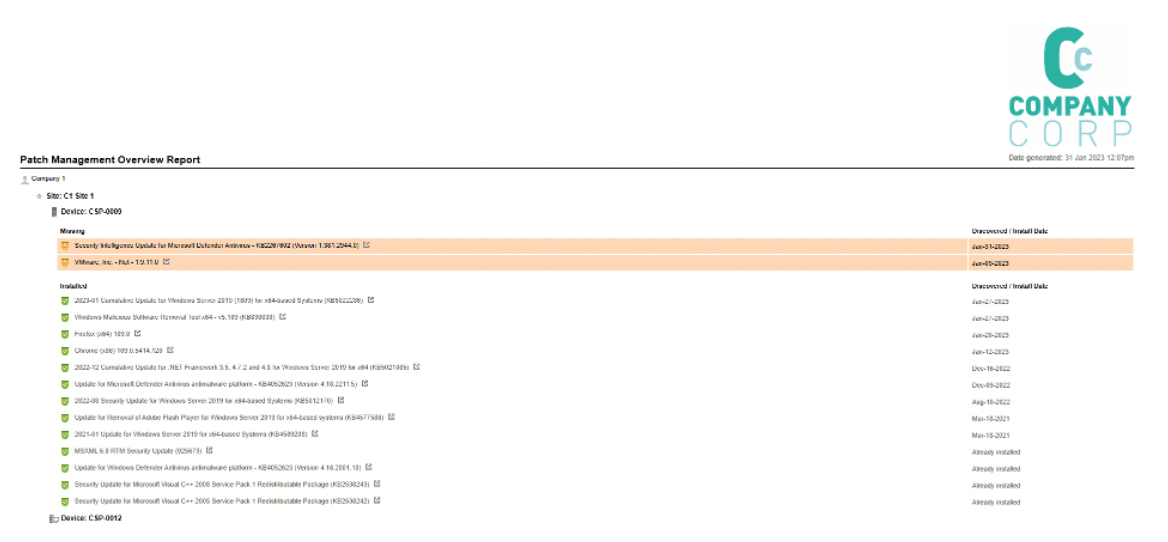
Customizable? Check. By Device, Site, or Status layout? Check. More information than you might need? Also, Check.
I ran this report every month and provided each of my customers with a version that at bare minimum showed missing, pending, installing, and installed patches. I think it goes without saying that this is a great report to provide in addition to the Executive Summary. Not only does it show that you are completing the task that most end users are familiar with but, doing it in a concise and consistent fashion. There is not much to say here other than if you are not providing this during a MBR or QBR you are missing out. You do not have to hit this report in true detail in every QBR, but it is best to have it on hand if your end users request it.
Honorable mention—User Audit Report
I would often use this report in QBRs as a “covering-my-butt” tool. If I had an end user that was very into who did what, when, and where, I would pull a User Audit Report that spanned a full month, export it, and parse out all information that pertained to the end user. This was time-consuming and tedious, to say the least. However, it did save me multiple times when I was able to show almost everything that I did in N-sight for the end user over the past month.
That being said this was not for every end user and I did not go over it in a QBR, I just included it as an addendum to the above MSP client reporting and if it came up I could reference it.
If you have any more questions on N-able RMM solutions, you can get in touch with Joe on his contacts below. And if you want to keep up to date with our Head Nerd Boot Camps and Office Hours, visit the Head Nerds events page.
Joseph Ferla is one of our Head Nerds. You can follow him on Twitter @headnerdjoe or on LinkedIn.
© N-able Solutions ULC e N-able Technologies Ltd. Tutti i diritti riservati.
Il presente documento viene fornito per puro scopo informativo e i suoi contenuti non vanno considerati come una consulenza legale. N-able non rilascia alcuna garanzia, esplicita o implicita, né si assume alcuna responsabilità legale per quanto riguarda l’accuratezza, la completezza o l’utilità delle informazioni qui contenute.
N-ABLE, N-CENTRAL e gli altri marchi e loghi di N-able sono di esclusiva proprietà di N-able Solutions ULC e N-able Technologies Ltd. e potrebbero essere marchi di common law, marchi registrati o in attesa di registrazione presso l’Ufficio marchi e brevetti degli Stati Uniti e di altri paesi. Tutti gli altri marchi menzionati qui sono utilizzati esclusivamente a scopi identificativi e sono marchi (o potrebbero essere marchi registrati) delle rispettive aziende.