
Expanding Your N‑central Monitoring Capabilities with Log File Monitoring

By Paul Kelly

When it comes to monitoring your IT environment, flexibility is key. While N‑central offers a robust set of predefined monitoring services, there are instances when you need to monitor applications that don’t come with out-of-the-box support. That’s where log file monitoring becomes a powerful tool.
So in this blog, I’ll walk you through how to set this up using the Log Analysis (Append) service in N‑central.
Why Use Log File Monitoring?
Many applications generate log files that record vital information, from performance events to error states. In my case, I needed to monitor a backup application that writes its success or failure status to a log file. If a backup fails, I want to be notified immediately. That’s exactly what log analysis can do for us.
Setting Up Log Analysis (Append) in N‑central
Here’s a step-by-step guide to implementing log file monitoring in N‑central using the Log Analysis (Append) service:
1. Choose the Device
First, log in to your N‑central environment and checkbox select the device you wish to configure the monitoring on.
2. Add the Log Analysis (Append) Service
- Click Add Service on the All Devices dashboard.
- From the Local Agent section, scroll down to find Log Analysis (Append).
- Add an instance of this service to your selected device.
Note: You can configure up to 10 instances per device.
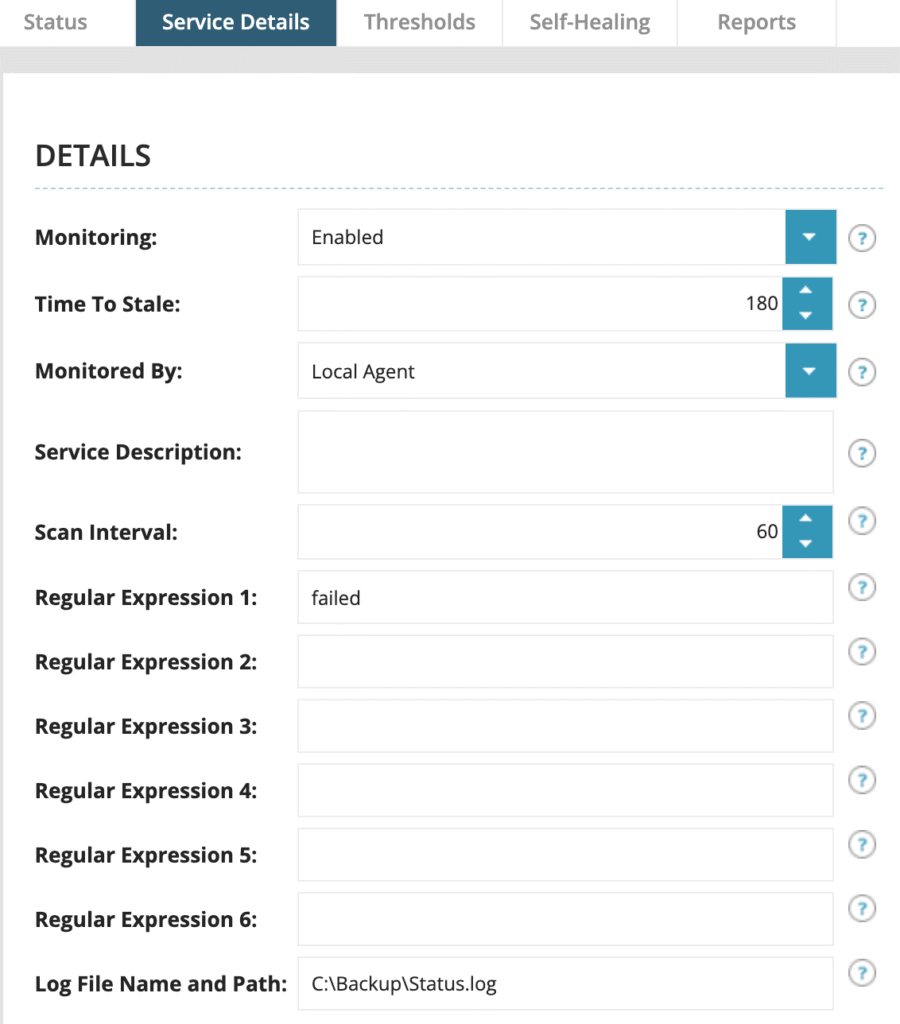
3. Configure the Log File Monitoring
Once the service is added:
- Click into the service to configure it.
- In the Service Details tab, specify the path to the log file. In my example, it’s: C:\Backup\Status.log
- Set the scan interval, I use every 60 minutes, but this can be tailored to suit your needs.
- Define the search term or pattern. Here, I’m looking for the word “failed” to catch any backup failures.
Click OK to save the configuration.
Monitoring in Action
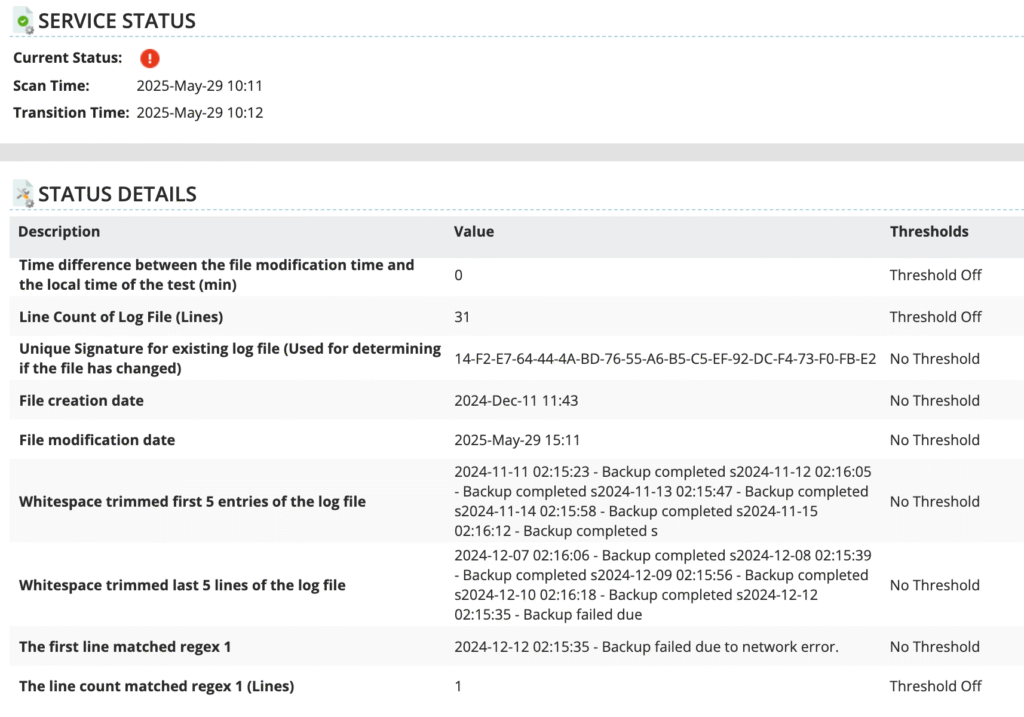
Initially, the service may show as misconfigured, this is expected until the first scan occurs. Once scanned:
- Green indicates a normal state.
- Red indicates a failure has been detected.
In our example, the initial scan reads the current log, showing all backups are successful, so the service remains green.
![]()
To simulate a failure, I manually added a line to the log file indicating a failed backup and saved the file. After the next scheduled scan, the Log Analysis service:
- Detected the keyword “failed”,
- Switched the service status to red,
- Provided detailed information showing the exact match and location in the log file.
With the Log Analysis (Append) service in N‑central, you can extend your monitoring capabilities beyond what’s offered by default. Whether it’s a custom application, a legacy system, or a simple log file you want to keep an eye on, this service gives you real-time insights and alerts, helping you take action before small issues become big problems.
Ready to try it out? Dive into your N‑central environment and start monitoring those critical logs today!
Paul Kelly is the Head Nerd for N‑central at N‑able. You can follow him on LinkedIn and Reddit at u/Paul _Kelly. Alternatively you can email me direct.
© N‑able Solutions ULC e N‑able Technologies Ltd. Todos os direitos reservados.
Este documento é fornecido apenas para fins informativos e não deve servir de base para aconselhamento jurídico. A N‑able não oferece nenhuma garantia, expressa ou implícita, nem assume qualquer responsabilidade legal ou responsabilidade pela precisão, integralidade ou utilidade de qualquer informação nele contido.
As marcas N-ABLE, N-CENTRAL e outras marcas registradas e logotipos N‑able são de propriedade exclusiva da N‑able Solutions ULC e da N‑able Technologies Ltd e podem ser marcas legais comuns, registradas ou de registro pendente com o Escritório de Marcas e Patentes dos EUA e com outros países. Todas as outras marcas comerciais mencionadas neste documento são usadas apenas para fins de identificação e são marcas comerciais (e poderão ser marcas registradas) de suas respectivas empresas.